

代码拉取完成,页面将自动刷新
同步操作将从 antv/G6 强制同步,此操作会覆盖自 Fork 仓库以来所做的任何修改,且无法恢复!!!
确定后同步将在后台操作,完成时将刷新页面,请耐心等待。

![]()
![]()
![]()


![]()
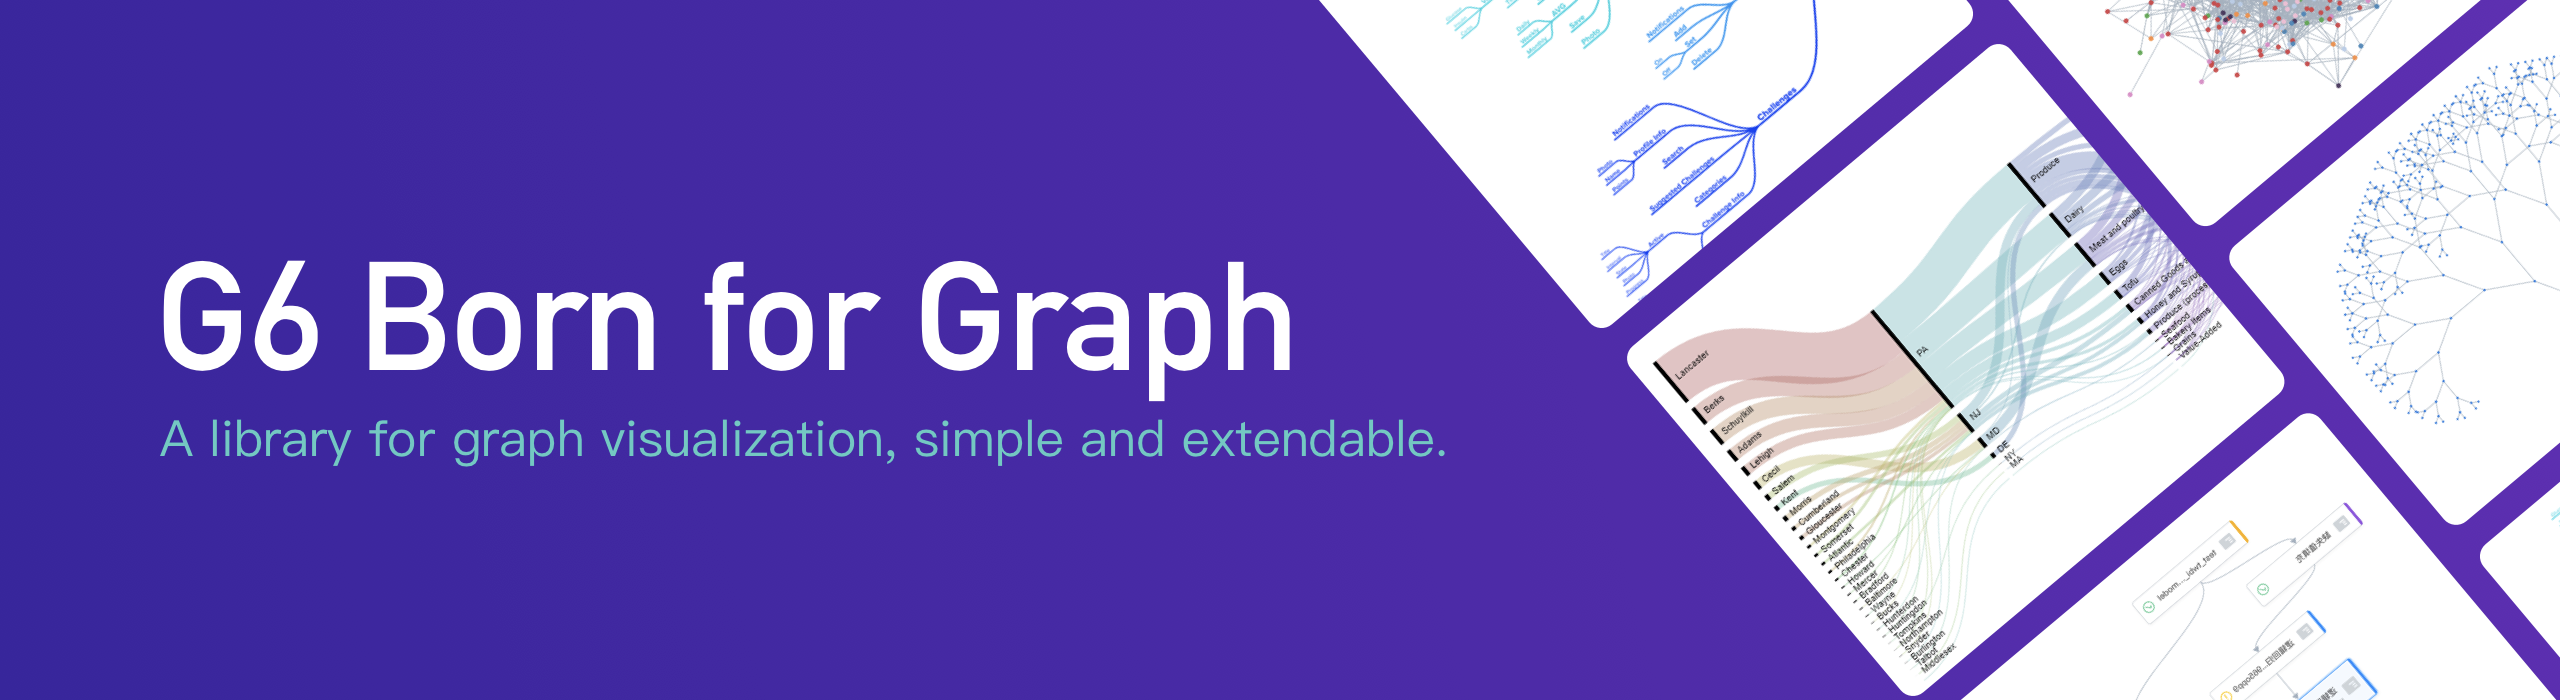
G6 是一个图可视化框架。它提供了一套图可视化的基础设置,包括渲染、布局、交互、动画、分析、辅助工具等。帮助开发者搭建属于自己的图 图分析 应用或是 图编辑器 应用。 详情请见开发文档。


$ npm install @antv/g6

import G6 from '@antv/g6';

const data = {
  nodes: [
    {
      id: 'node1',
      x: 100,
      y: 200,
    },
    {
      id: 'node2',
      x: 300,
      y: 200,
    },
  ],
  edges: [
    {
      target: 'node2',
      source: 'node1',
    },
  ],
};
const graph = new G6.Graph({
  container: 'mountNode',
  width: 500,
  height: 500,
  defaultNode: {
    type: 'circle',
    style: {
      fill: '#40a9ff',
      stroke: '#096dd9',
    },
  },
  nodeStateStyles: {
    hover: {
      lineWidth: 3,
    },
    select: {
      lineWidth: 5,
    },
  },
});
graph.data(data);
graph.render();
$ npm install

# run test case
$ npm run test-live

# build watching file changes and run demos
$ npm run dev
请让我们知道您要解决或贡献什么,所以在贡献之前请先提交 issues 描述 bug 或建议。
成为一个贡献者前请阅读 代码贡献规范.
此处可能存在不合适展示的内容,页面不予展示。您可通过相关编辑功能自查并修改。
如您确认内容无涉及 不当用语 / 纯广告导流 / 暴力 / 低俗色情 / 侵权 / 盗版 / 虚假 / 无价值内容或违法国家有关法律法规的内容,可点击提交进行申诉,我们将尽快为您处理。


