

代码拉取完成,页面将自动刷新


SRS supports gprof performance analysis.
To use gprof to test SRS performance:
./configure --with-gprof
make
rm -f gmon.out; ./objs/srs -c conf/console.conf
killall -2 srs # or CTRL+C to stop gprof
gprof -b ./objs/srs gmon.out > gprof.srs.log && rm -f gmon.out
The report saved in gprof.srs.log:
Each sample counts as 0.01 seconds.
  %   cumulative   self              self     total
 time   seconds   seconds    calls   s/call   s/call  name
 49.99     39.28    39.28                             writev
  5.42     43.54     4.26                             epoll_ctl
  3.16     46.02     2.48                             read
  2.41     47.91     1.89   265797     0.00     0.00  SrsProtocol::send_message(ISrsMessage*)
  1.93     49.43     1.52                             __gnu_mcount_nc
  1.82     50.86     1.43                             epoll_wait
  1.67     52.17     1.31       33     0.04     0.42  SrsRtmpConn::playing(SrsSource*)
  1.49     53.34     1.17                             heap_insert
  1.37     54.42     1.08                             heap_delete
  1.31     55.45     1.03                             _st_epoll_dispatch
  0.97     56.21     0.76                             st_writev
  0.84     56.87     0.66                             _st_epoll_pollset_del
  0.71     57.43     0.56   295144     0.00     0.00  SrsProtocol::recv_interlaced_message
Note: The performance is different for different streams, clients, cpus or config.
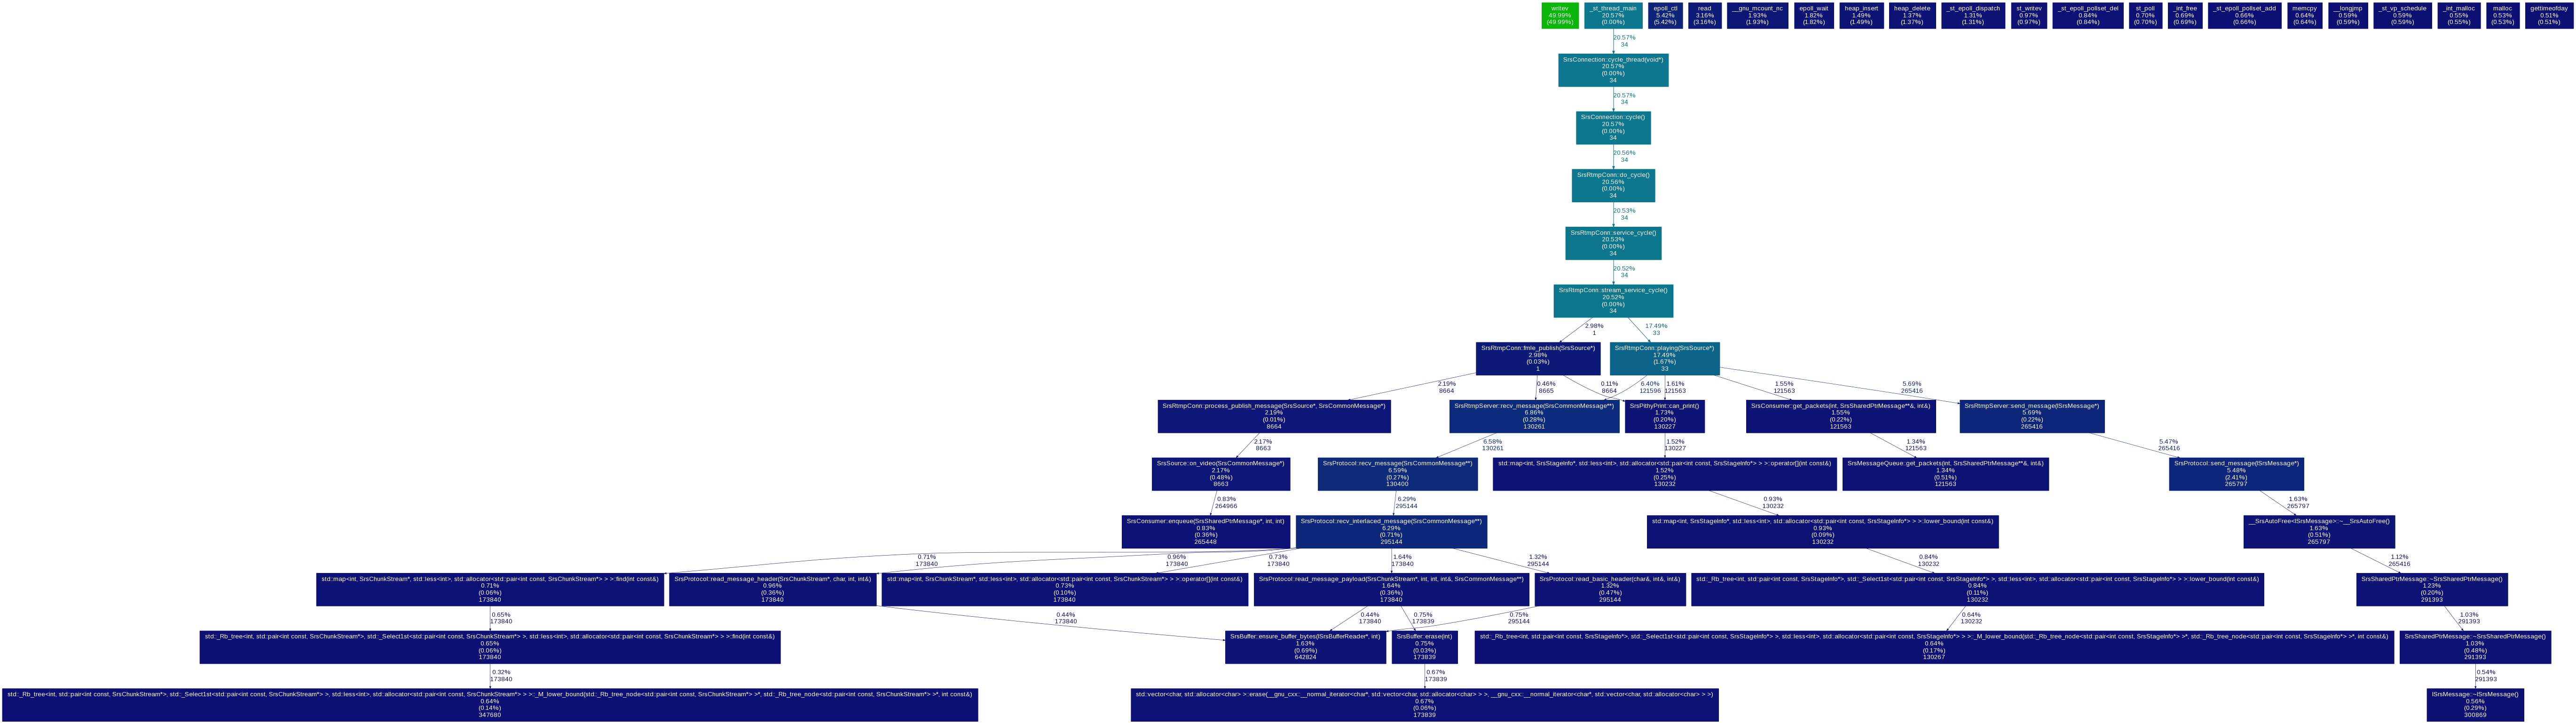
The result of gprof can draw to call graphics:
SRS performance analysis.(cd 3rdparty/gprof && bash build_gprof2dot.sh)
./objs/srs -c conf/console.conf
gprof -b ./objs/srs gmon.out > gprof.srs.log
./3rdparty/gprof/gprof2dot.py gprof.srs.log | dot -Tpng -o winlin.png
It is obviously to finger the low performance functions:
Winlin 2014.11
此处可能存在不合适展示的内容,页面不予展示。您可通过相关编辑功能自查并修改。
如您确认内容无涉及 不当用语 / 纯广告导流 / 暴力 / 低俗色情 / 侵权 / 盗版 / 虚假 / 无价值内容或违法国家有关法律法规的内容,可点击提交进行申诉,我们将尽快为您处理。


