

Fetch the repository succeeded.
An iOS Line Chart v1.1.0
An iOS Line Chart v1.1. An iOS Line Chart v1.1.2
https://www.paypal.com/cgi-bin/webscr?cmd=_s-xclick&hosted_button_id=L7GRLYEWFGSVE
It's a fully customizable Line chart using Interface Builder. I hope that it could be useful in your app. Any feedback are welcome
##Requirements
What you have to do is to include APChartView directory in your project.
Than you have to use APChartView as Class used within Custom Class of the View that will use the Control. Next you have to link it to a class attribute, like you usually should do.
than you are free to customize it and to see the updates in realtime.
In order to add one or more line you have to simple follow these instructions:
// create a line
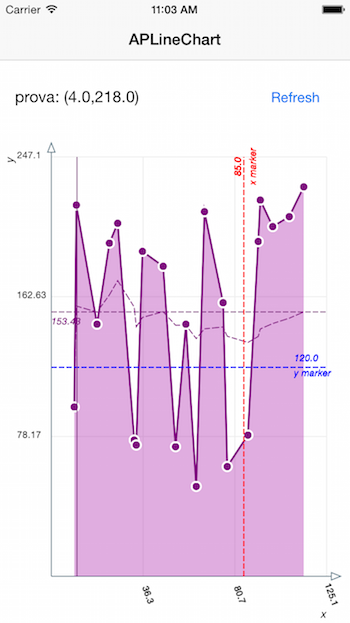
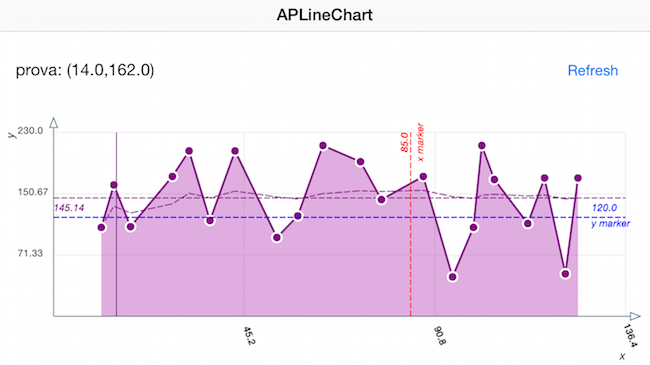
var line = APChartLine(chartView: chart, title: "prova", lineWidth: 2.0, lineColor: UIColor.purpleColor())
//add points to this line:
line.addPoint( CGPoint(x: 12.0, y: 24.0y))
line.addPoint( CGPoint(x: 16.0, y: 16.0y))
line.addPoint( CGPoint(x: 19.0, y: 20.0y))
line.addPoint( CGPoint(x: 21.0, y: 18.0y))
// and add the line to the chart:
chart.addLine(line)
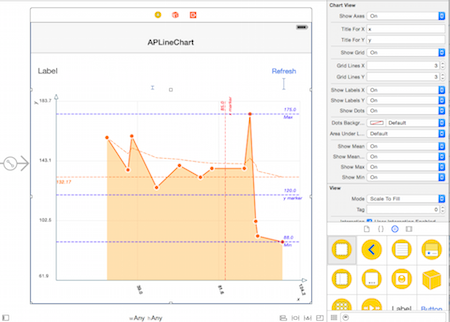
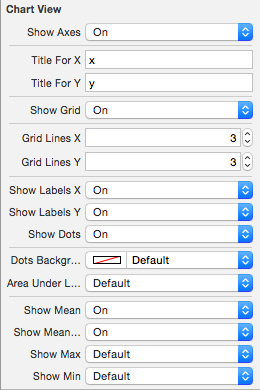
showAxes:Bool // display or not axis
titleForX:String // title for X coordinate
titleForY:String // title for Y coordinate
axesColor = UIColor(red: 96/255.0, green: 125/255.0, blue: 139/255.0, alpha: 1)

showGrid:Bool // Display or not the Grid
gridColorUIColor // Grid Color
gridLinesX: CGFloat // number of X grid lines
gridLinesY: CGFloat // number of Y grid lines
showLabelsX:Bool // display or not the labels of X grid intervals
showLabelsY:Bool // display or not the labels of Y grid intervals

showDots:Bool // display or not the Dots
dotsBackgroundColor:UIColor // dot color
showMean:Bool // display or not the Average value
showMeanProgressive:Bool // display or not the Average value calculated in progression
showMax:Bool
showMin:Bool
此处可能存在不合适展示的内容,页面不予展示。您可通过相关编辑功能自查并修改。
如您确认内容无涉及 不当用语 / 纯广告导流 / 暴力 / 低俗色情 / 侵权 / 盗版 / 虚假 / 无价值内容或违法国家有关法律法规的内容,可点击提交进行申诉,我们将尽快为您处理。


