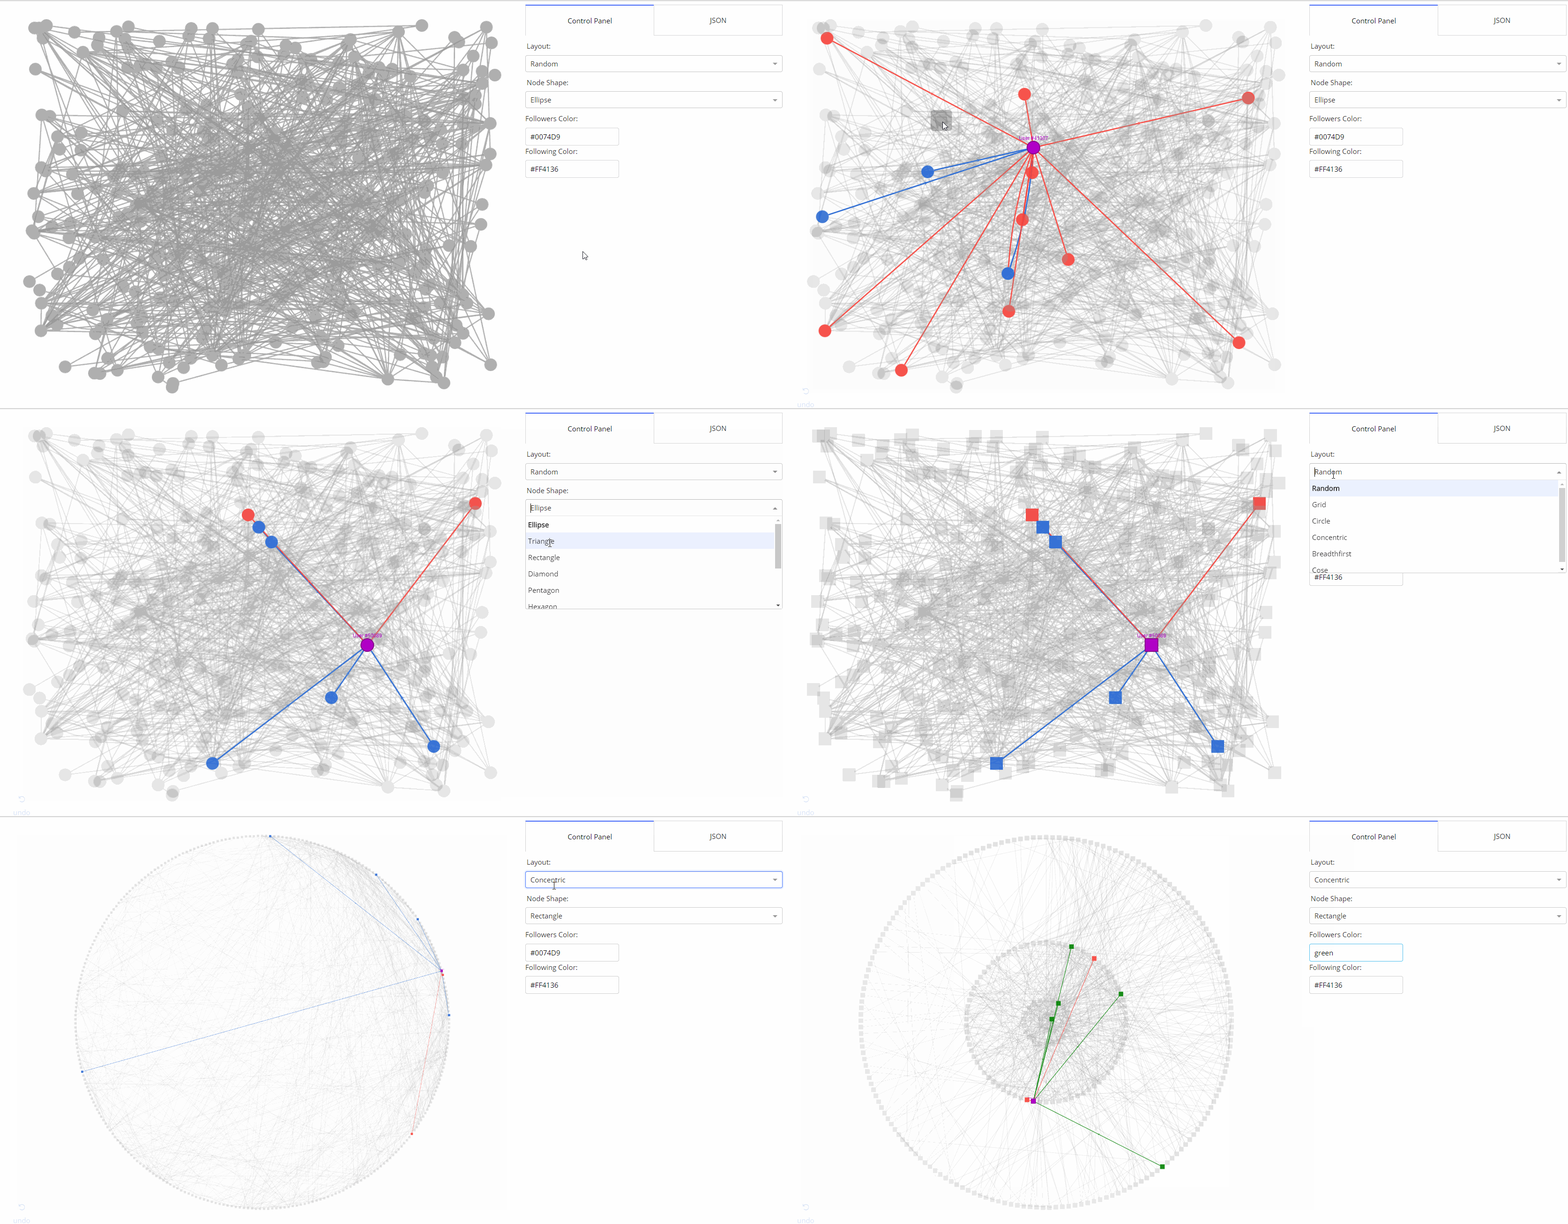

A Dash component library for creating interactive and customizable networks in Python, wrapped around Cytoscape.js.

Make sure that dash and its dependent libraries are correctly installed:
pip install dash dash-html-components
If you want to install the latest versions, check out the Dash docs on installation.
install.packages(c("devtools", "dash"))
Install the library using pip:
pip install dash-cytoscape
Create the following example inside an app.py file:
import dash
import dash_cytoscape as cyto
import dash_html_components as html

app = dash.Dash(__name__)
app.layout = html.Div([
    cyto.Cytoscape(
        id='cytoscape',
        elements=[
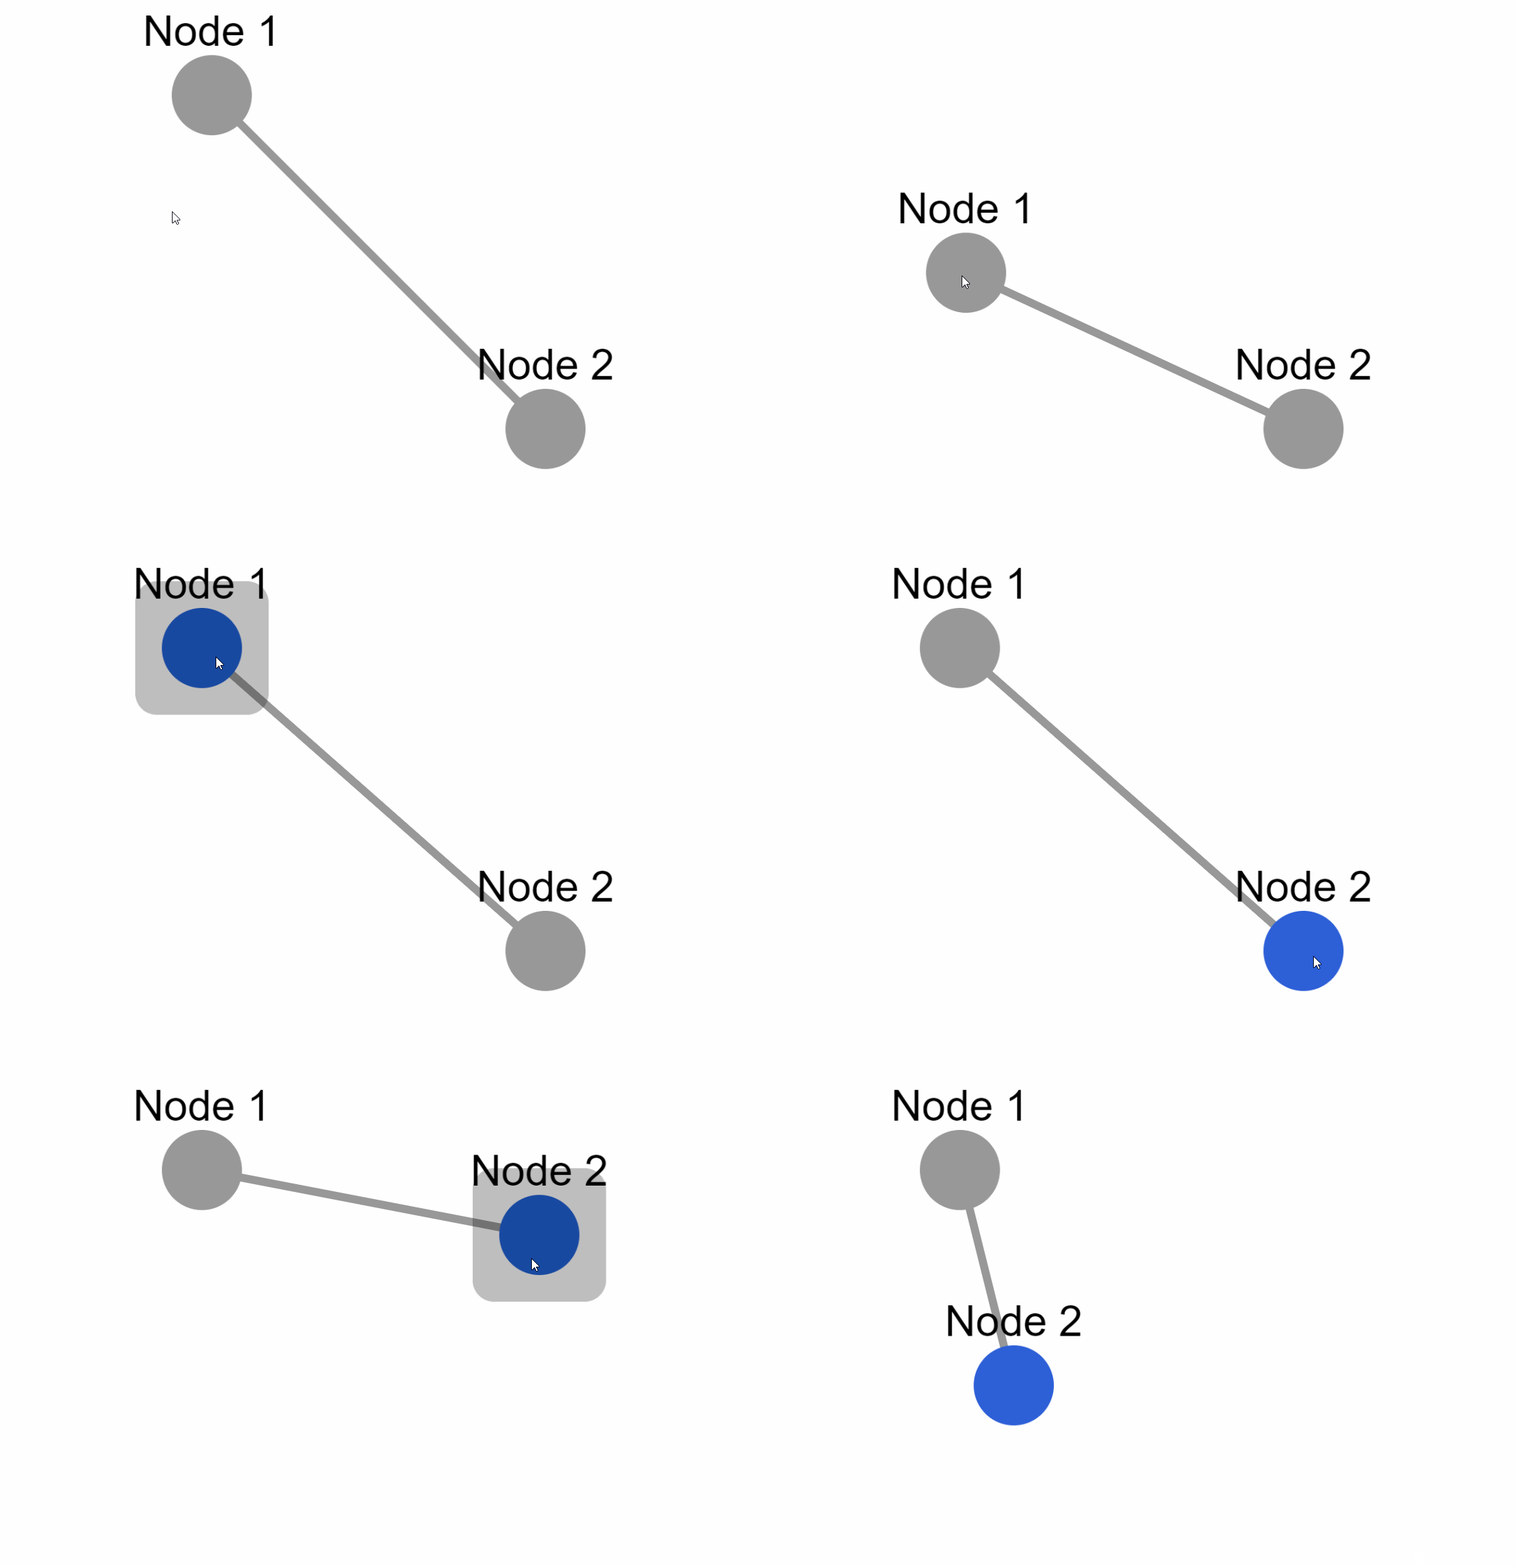
            {'data': {'id': 'one', 'label': 'Node 1'}, 'position': {'x': 50, 'y': 50}},
            {'data': {'id': 'two', 'label': 'Node 2'}, 'position': {'x': 200, 'y': 200}},
            {'data': {'source': 'one', 'target': 'two','label': 'Node 1 to 2'}}
        ],
        layout={'name': 'preset'}
    )
])

if __name__ == '__main__':
    app.run_server(debug=True)

Install the library using devtools:
devtools::install_github("plotly/dash-cytoscape")
Create the following example inside an app.R file:
library(dash)
library(dashHtmlComponents)
library(dashCytoscape)

app <- Dash$new()

app$layout(
  htmlDiv(
    list(
      cytoCytoscape(
        id = 'cytoscape-two-nodes',
        layout = list('name' = 'preset'),
        style = list('width' = '100%', 'height' = '400px'),
        elements = list(
          list('data' = list('id' = 'one', 'label' = 'Node 1'), 'position' = list('x' = 75, 'y' = 75)),
          list('data' = list('id' = 'two', 'label' = 'Node 2'), 'position' = list('x' = 200, 'y' = 200)),
          list('data' = list('source' = 'one', 'target' = 'two'))
        )
      )
    )
  )
)

app$run_server()
You can also add external layouts. Use the cyto.load_extra_layouts() function to get started:
import dash
import dash_cytoscape as cyto
import dash_html_components as html

cyto.load_extra_layouts()

app = dash.Dash(__name__)
app.layout = html.Div([
    cyto.Cytoscape(...)
])
The Dash Cytoscape User Guide contains everything you need to know about the library. It contains useful examples, functioning code, and is fully interactive. You can also use the component reference for a complete and concise specification of the API.
To learn more about the core Dash components and how to use callbacks, view the Dash documentation.
For supplementary information about the underlying Javascript API, view the Cytoscape.js documentation.
Make sure that you have read and understood our code of conduct, then head over to CONTRIBUTING to get started.
Dash, Cytoscape.js and Dash Cytoscape are licensed under MIT. Please view LICENSE for more details.
See https://plotly.com/dash/support for ways to get in touch.
Huge thanks to the Cytoscape Consortium and the Cytoscape.js team for their contribution in making such a complete API for creating interactive networks. This library would not have been possible without their massive work!
The Pull Request and Issue Templates were inspired from the scikit-learn project.
For an extended gallery, visit the demos' readme.
此处可能存在不合适展示的内容,页面不予展示。您可通过相关编辑功能自查并修改。
如您确认内容无涉及 不当用语 / 纯广告导流 / 暴力 / 低俗色情 / 侵权 / 盗版 / 虚假 / 无价值内容或违法国家有关法律法规的内容,可点击提交进行申诉,我们将尽快为您处理。