

代码拉取完成,页面将自动刷新
HOME > CN > GPROF Performance


SRS支持gprof性能分析。
SRS使用gprof分析的步骤如下:
./configure --with-gprof
make
rm -f gmon.out; ./objs/srs -c conf/console.conf
killall -2 srs # or CTRL+C to stop gprof
gprof -b ./objs/srs gmon.out > gprof.srs.log && rm -f gmon.out
可以打开gprof.srs.log查看性能报告,譬如(raspberry-pi下30个连接的性能数据):
Each sample counts as 0.01 seconds.
  %   cumulative   self              self     total
 time   seconds   seconds    calls   s/call   s/call  name
 49.99     39.28    39.28                             writev
  5.42     43.54     4.26                             epoll_ctl
  3.16     46.02     2.48                             read
  2.41     47.91     1.89   265797     0.00     0.00  SrsProtocol::send_message(ISrsMessage*)
  1.93     49.43     1.52                             __gnu_mcount_nc
  1.82     50.86     1.43                             epoll_wait
  1.67     52.17     1.31       33     0.04     0.42  SrsRtmpConn::playing(SrsSource*)
  1.49     53.34     1.17                             heap_insert
  1.37     54.42     1.08                             heap_delete
  1.31     55.45     1.03                             _st_epoll_dispatch
  0.97     56.21     0.76                             st_writev
  0.84     56.87     0.66                             _st_epoll_pollset_del
  0.71     57.43     0.56   295144     0.00     0.00  SrsProtocol::recv_interlaced_message
注意:性能分析在不同的CPU压力下,不同的流条件,结果都不一样。所以需要在和实际应用较为接近的流码率,客户端连接数,机器型号和配置等等,环境一致的数据给出的报告,才能给改进有参考价值;否则可能改进后发现根本没有用(没有跑那个分支)。
gprof还能图形化,可以将结果绘制成调用图:
SRS性能分析。(cd 3rdparty/gprof && bash build_gprof2dot.sh)
./objs/srs -c conf/console.conf
gprof -b ./objs/srs gmon.out > gprof.srs.log
./3rdparty/gprof/gprof2dot.py gprof.srs.log | dot -Tpng -o winlin.png
图片中一眼就能看出性能有问题的函数(raspberry-pi下30个连接的性能数据),参考下图:
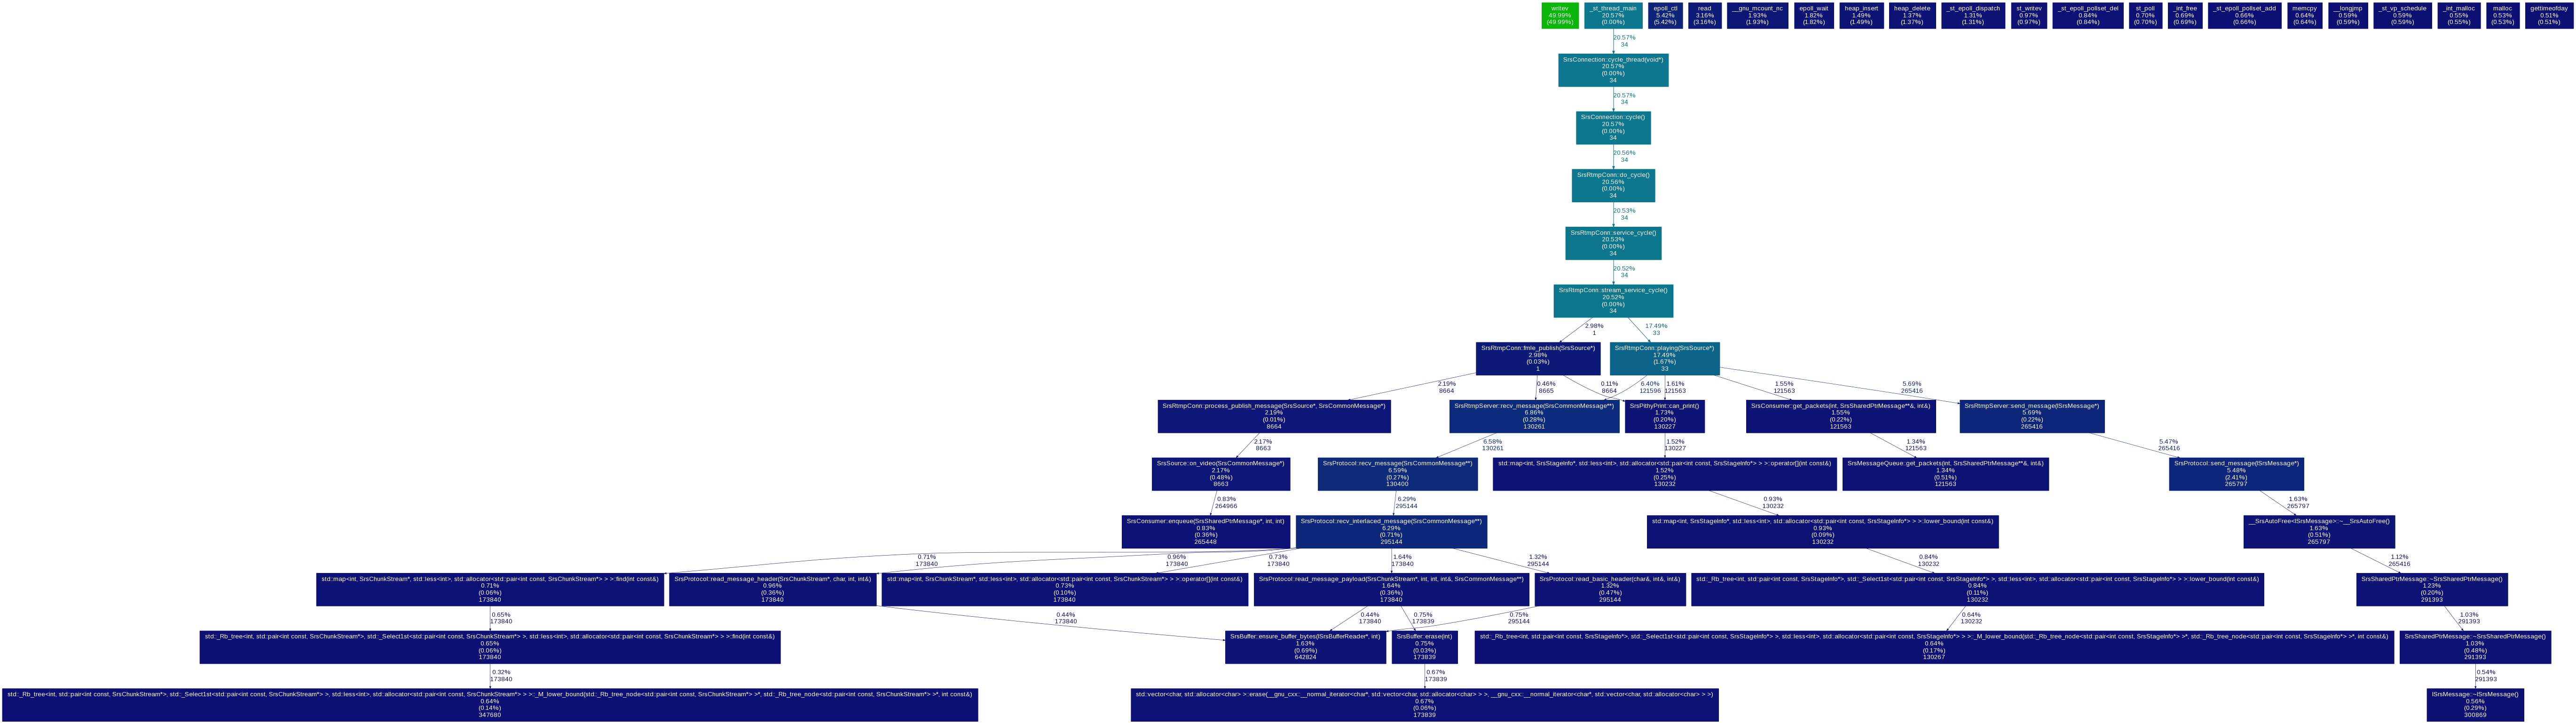
备注:有时候dot会占用N多内存,而且还出不了图片,这个应该是dot的bug。这时候赶快killall -9 dot,不要等了。有可能是因为性能数据太少,一般让SRS的CPU跑高点(5%以上),gprof的数据较多时,不会出现这种情况;若出现了,就重新gprof采样就好了。
Winlin 2014.3
此处可能存在不合适展示的内容,页面不予展示。您可通过相关编辑功能自查并修改。
如您确认内容无涉及 不当用语 / 纯广告导流 / 暴力 / 低俗色情 / 侵权 / 盗版 / 虚假 / 无价值内容或违法国家有关法律法规的内容,可点击提交进行申诉,我们将尽快为您处理。


